Database Dashboard
The Database Dashboard is the central command center of the DataKook solution. Once you select a database from the main dashboard, you are taken to this comprehensive workspace where every database operation is at your fingertips — from writing and executing SQL queries, to exploring schemas, analyzing data visually, and leveraging AI-powered natural-language querying.
The Database Dashboard consolidates a wide range of powerful capabilities into a single, unified interface. Rather than switching between separate tools for querying, diagramming, auditing, and data transfer, DataKook brings everything together so you can work faster and with greater confidence in the accuracy of your data.
From the Database Dashboard you can:
- Analyze and Visualize Data — Built-in tools let you create instant charts, apply advanced filters, and gain actionable insights directly from your tables and views without exporting data to external tools.
- Edit, Query, and Transfer Data — A full-featured SQL editor with syntax highlighting, autocomplete, and result export capabilities allows you to run any query and move data between formats effortlessly.
- Use AI to Query Data — A conversational AI assistant translates your natural-language questions into optimized SQL queries, making data exploration accessible to every team member regardless of their SQL expertise.
- Explore Database Objects — Browse all tables, views, stored procedures, functions, and other schema objects in an organized tree structure with instant search and filtering.
- View Database and Table Diagrams — Automatically generated entity-relationship diagrams visualize your database structure, table relationships, primary and foreign keys, and cardinalities at a glance.
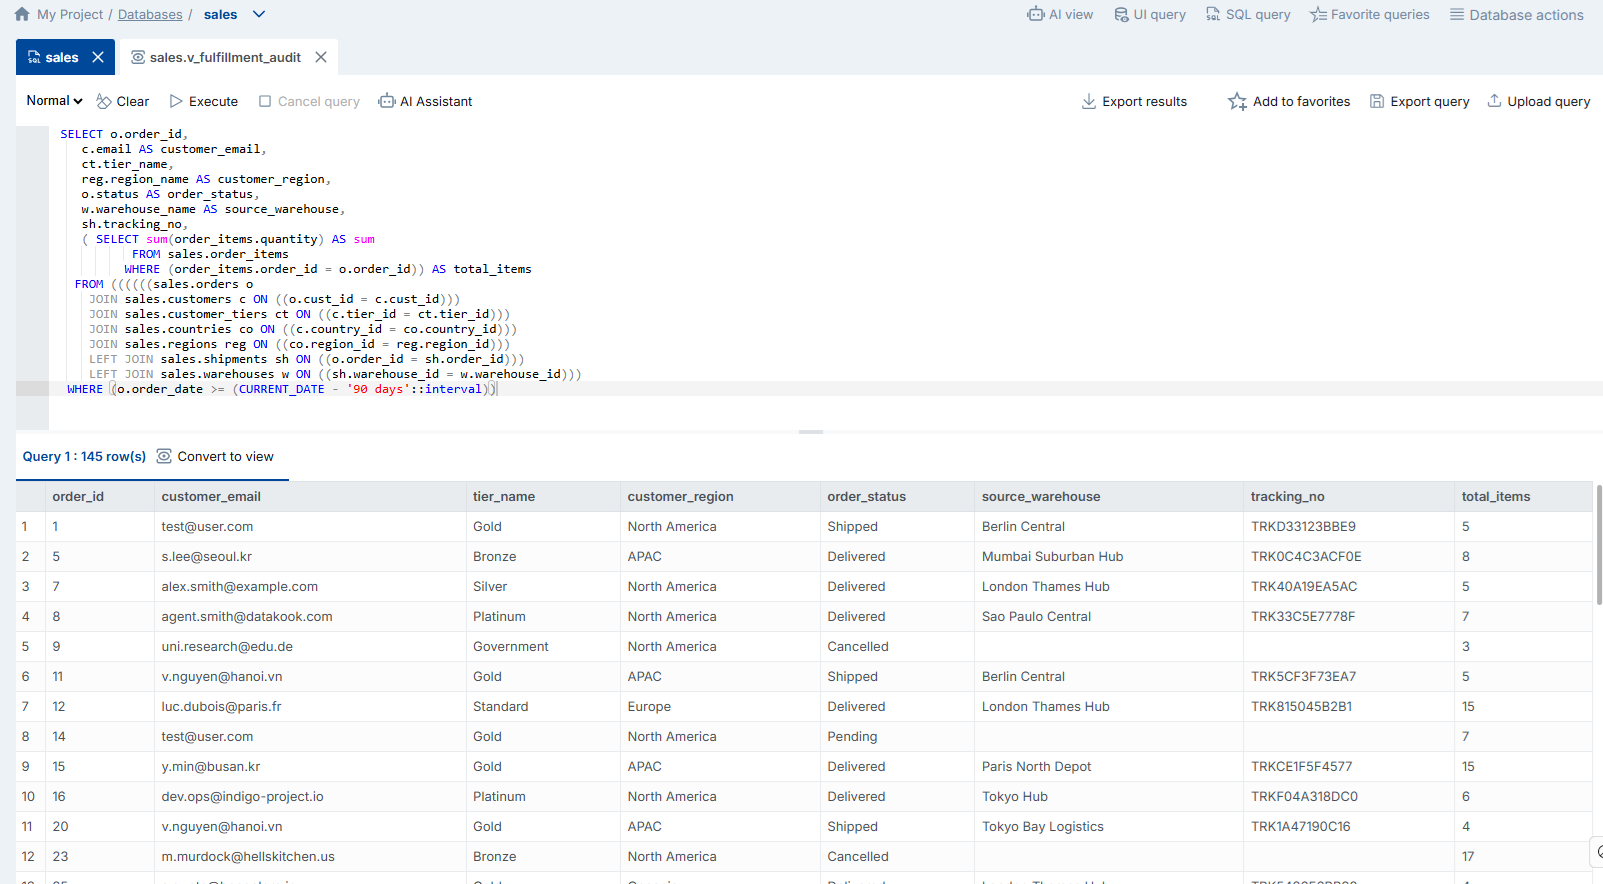
1. SQL Query
The SQL Query editor is a powerful, browser-based environment that lets you write, execute, and manage SQL queries directly within DataKook — no external IDE or database client required.
The editor is designed to feel familiar to developers and data analysts alike. It features a beautifully styled code area with full syntax highlighting that color-codes SQL keywords, table names, string literals, and numeric values so your queries are easy to read and debug at a glance. As you type, the built-in autocomplete engine suggests table names, column names, SQL functions, and keywords based on the connected database schema, dramatically reducing typos and accelerating query authoring.
Key features of the SQL Query editor include:
- Syntax Highlighting — SQL keywords, identifiers, strings, and numbers are displayed in distinct colors, making complex queries easy to navigate visually.
- Intelligent Autocomplete — Context-aware suggestions for table names, column names, aliases, and SQL functions appear as you type, driven by the live schema of your connected database.
- Result Export — After executing a query, you can export the result set in multiple formats (CSV, Excel, JSON) with a single click, making it simple to share data with colleagues or import it into other tools.
- Favorite Queries — Save frequently used queries as favorites for instant reuse. Favorited queries can also be exposed as REST API endpoints or integrated into UI Apps, bridging the gap between ad-hoc analysis and production workflows.
- AI-Assisted Query Editing — At any point, you can invoke the AI Assistant directly from the editor to get help rewriting, optimizing, or explaining a query. The assistant understands your schema context and can suggest joins, aggregations, or performance improvements.
- Multi-Tab Support — Open multiple query tabs simultaneously to compare results, iterate on different approaches, or keep reference queries visible while working on new ones.
- Execution History — A running log of previously executed queries is maintained so you can quickly recall past work without re-typing.
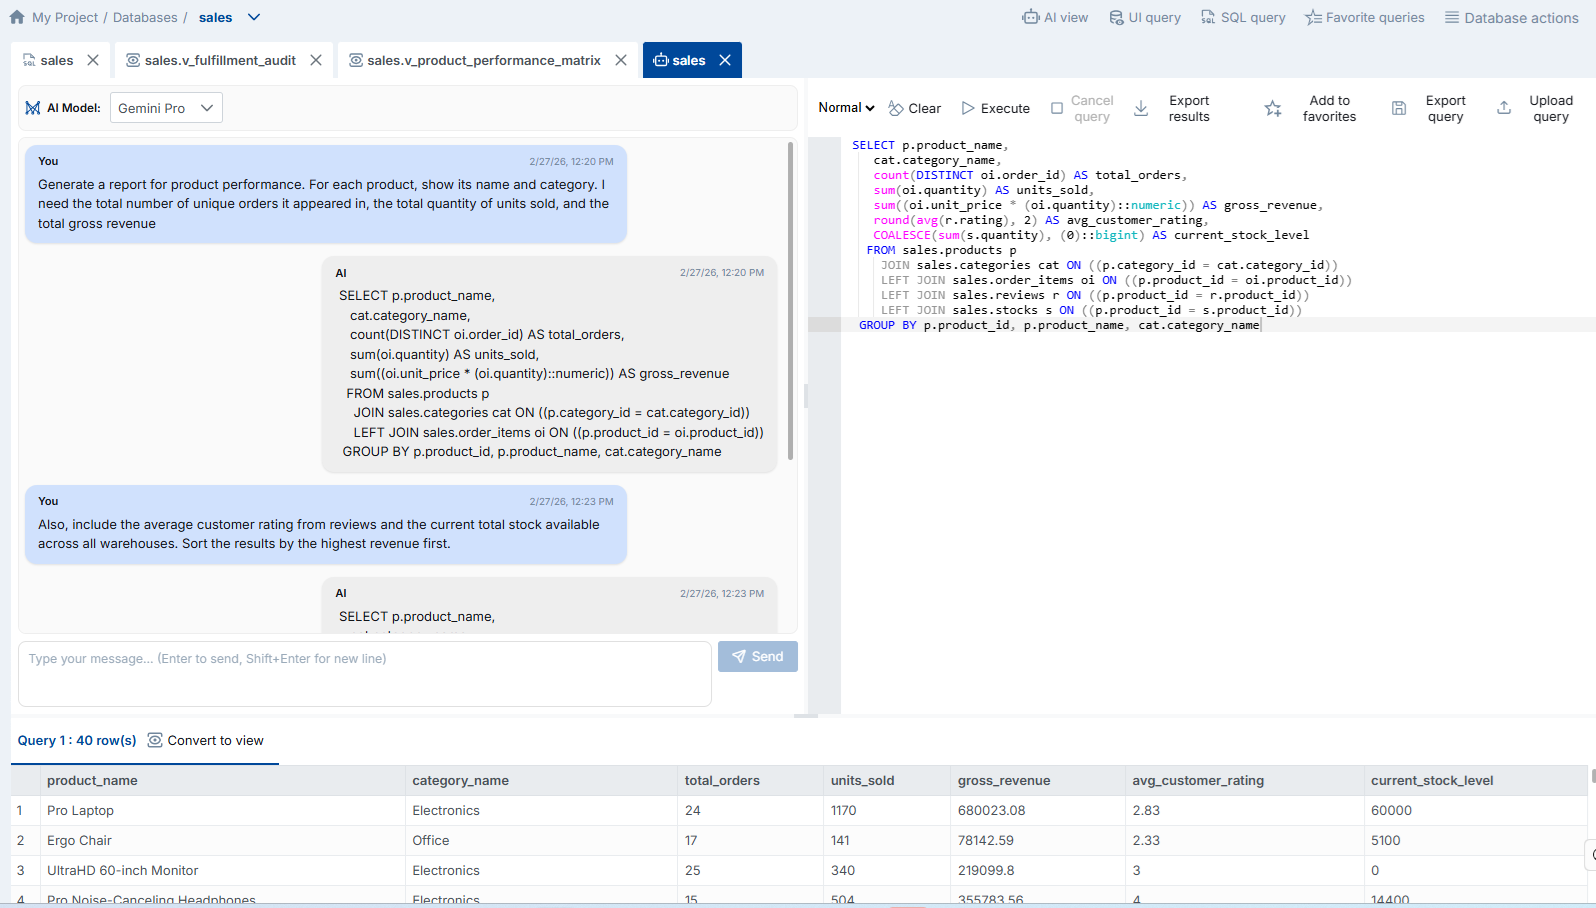
2. AI View
The AI View puts a conversational AI assistant at the core of your data exploration workflow. Instead of writing SQL manually, you describe what you need in plain, natural language — and the assistant generates the corresponding query, executes it, and displays the results.
This feature is designed for users of all skill levels. Business analysts who are not fluent in SQL can ask questions like "Show me the top 10 customers by total order value in the last quarter" and receive accurate results instantly. Experienced developers can use the AI View to rapidly prototype complex queries, then refine them in the SQL Query editor if needed.
How the AI View works:
- Natural Language Input — Type your data question in everyday language. The AI understands your database schema, table names, column types, and relationships, so it can translate your intent into a precise SQL statement.
- Conversational Refinement — If the initial result is not exactly what you expected, continue the conversation. Ask the assistant to add filters, change the sort order, include additional columns, or aggregate the data differently. The AI retains the context of the entire conversation, so each follow-up builds on the previous query.
- Schema Awareness — The assistant automatically maps your natural-language references to the correct tables and columns, even when names are abbreviated or ambiguous. It also respects foreign-key relationships to suggest appropriate joins.
- Query Transparency — Every generated SQL query is displayed alongside the results, so you always know exactly what was executed. You can copy the query to the SQL editor for further modification or save it as a favorite.
- Error Guidance — If a generated query encounters an error, the AI explains the issue and suggests corrections, turning debugging into a guided learning experience.
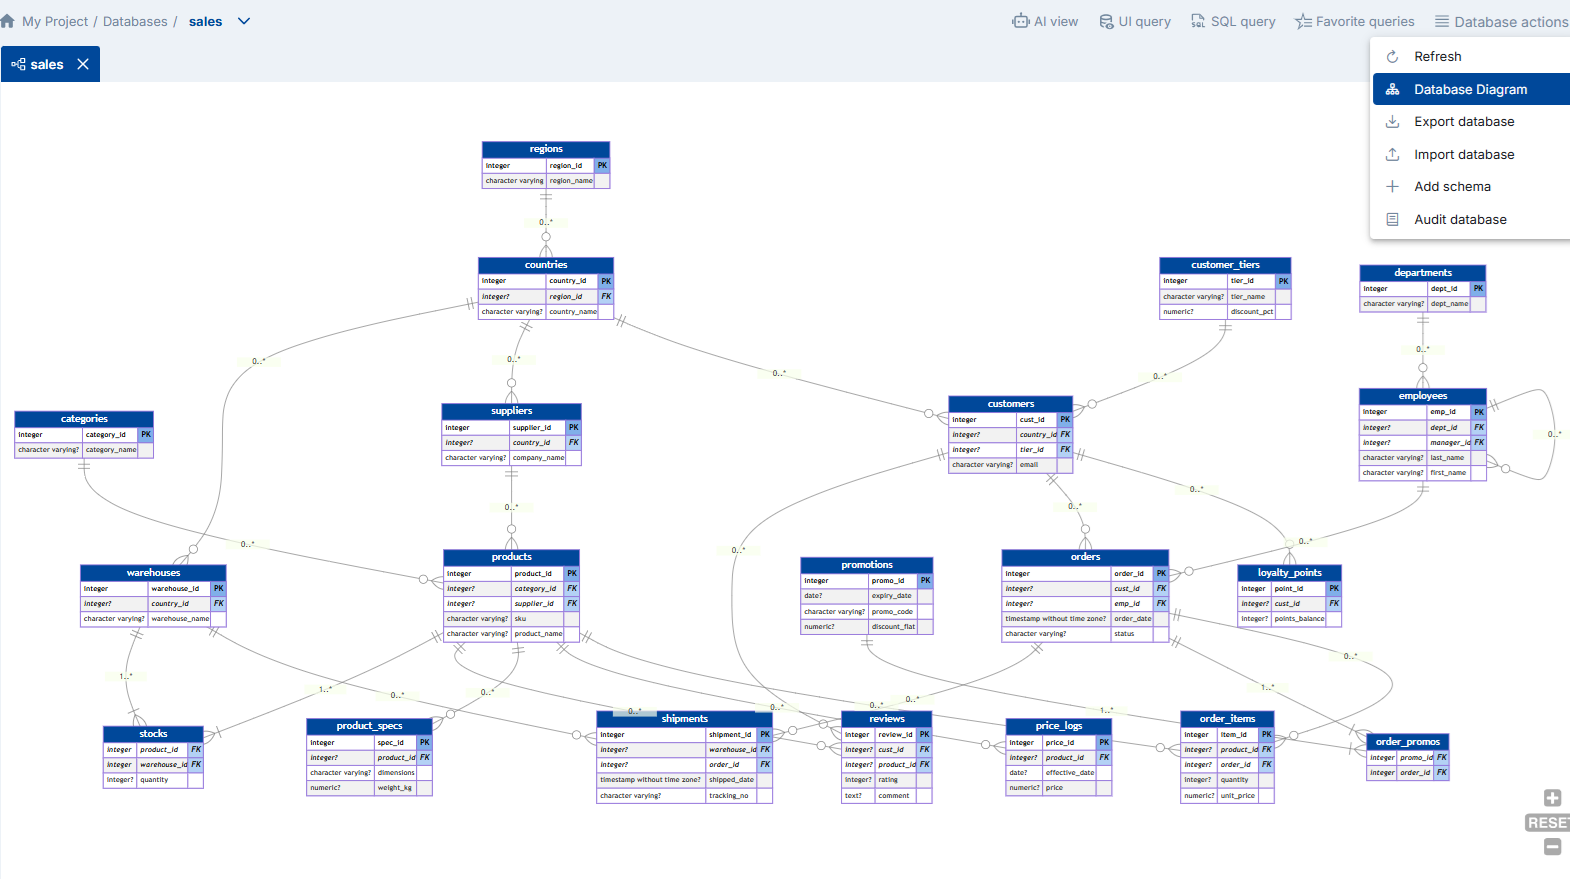
3. Database Actions
The Database Actions panel groups together the essential maintenance and inspection operations that apply to the entire database — including schema visualization, bulk data transfer, and comprehensive audit trails.
These actions complement the per-table operations by giving you a bird's-eye view of the database as a whole. Whether you need to generate a diagram for documentation, export a snapshot of your data for migration, or review a history of every change that has occurred, the Database Actions panel is where you start.
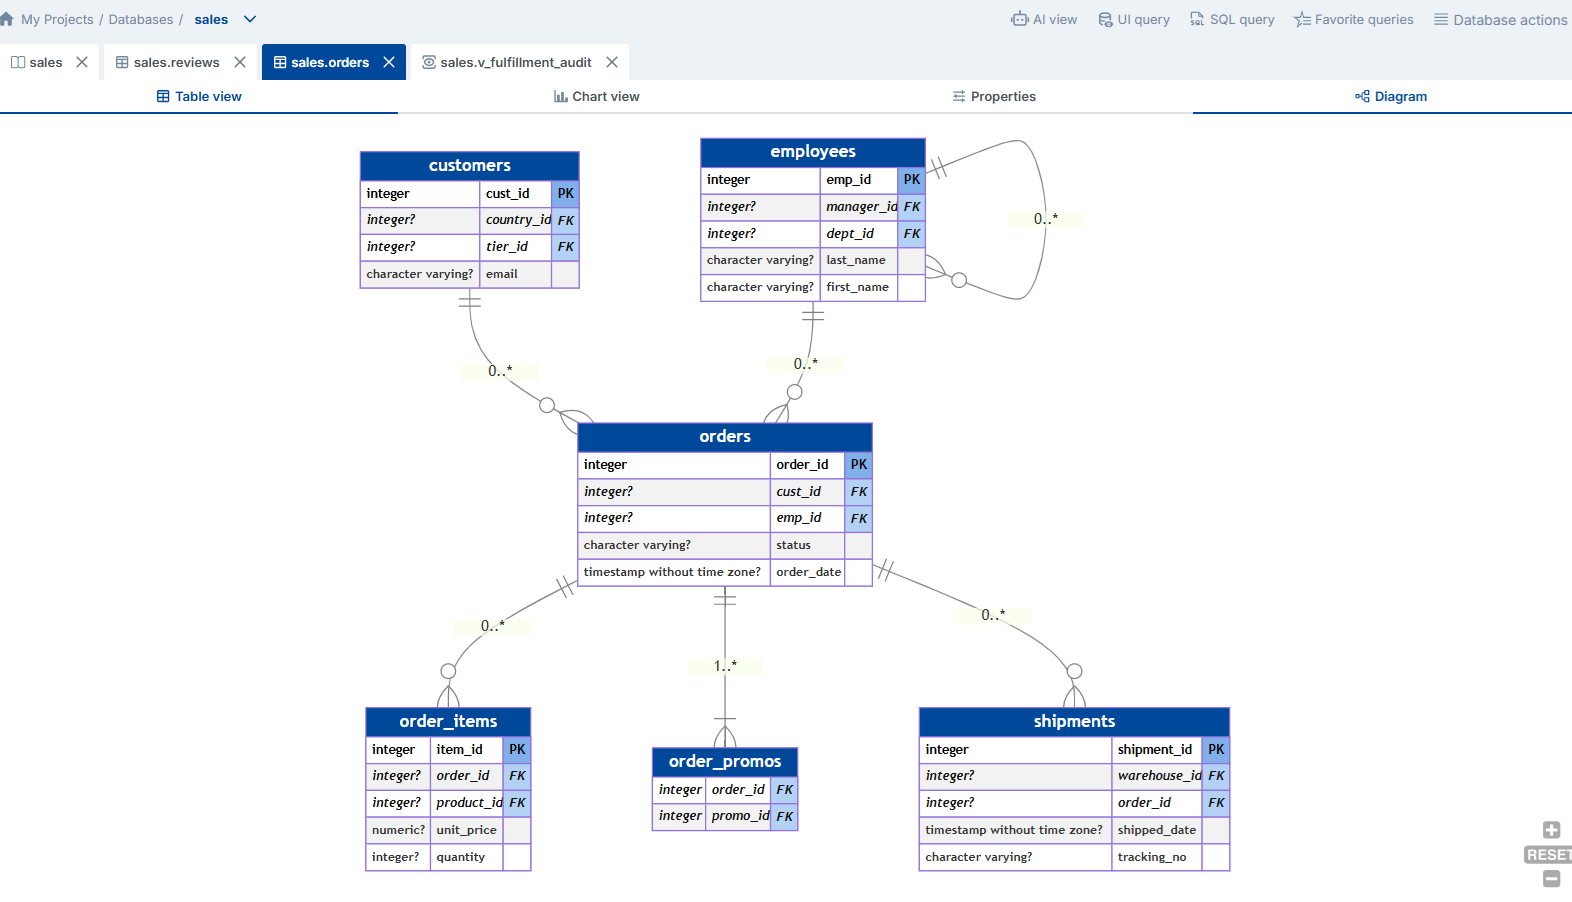
3.1 Database Diagram
The Database Diagram generates a visual, interactive entity-relationship diagram of your entire database structure. Every table is represented as a node displaying its columns, data types, and key indicators. Lines between tables represent foreign-key relationships, with cardinality markers (one-to-one, one-to-many, many-to-many) clearly visible at each endpoint.
This diagram is generated automatically from your live database schema — there is no manual drawing or configuration required. It updates dynamically whenever the schema changes, so your documentation is always in sync with reality.
The Database Diagram helps you:
- Understand Data Relationships — Quickly identify how tables are connected through primary and foreign keys, making it easier to write correct joins and understand data flow across the system.
- Onboard New Team Members — A visual map of the database is one of the most effective ways to bring new developers or analysts up to speed on the data model without requiring them to read through hundreds of DDL scripts.
- Document Your Architecture — Export or screenshot the diagram for inclusion in technical specifications, architecture reviews, or compliance documentation.
- Spot Design Issues — Orphaned tables (no relationships), missing indexes on foreign keys, or overly complex join paths become immediately visible in a diagram view that would be difficult to detect from raw DDL alone.
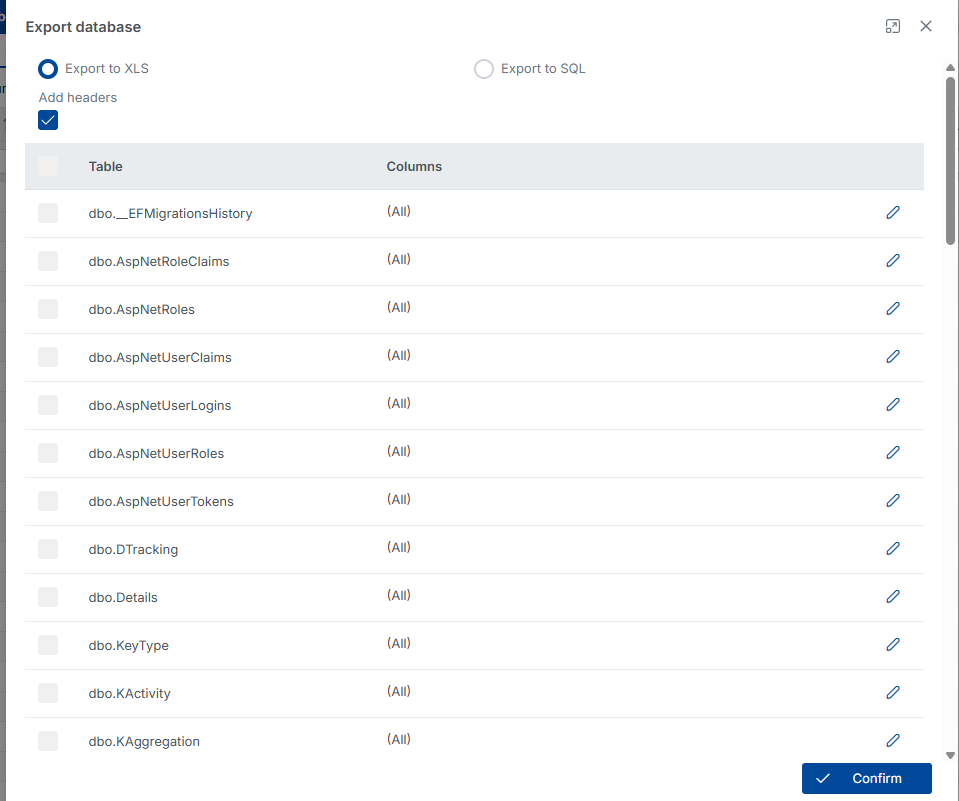
3.2 Database Export / Import
The Export / Import wizard provides a guided, step-by-step process for moving data into or out of your database in bulk. This is invaluable for data migration, environment seeding, backup snapshots, and cross-system data synchronization.
The wizard walks you through the following steps:
- Select Tables — Choose one or more tables to include in the export or import operation. You can select individual tables or use the "Select All" shortcut for a full database transfer.
- Choose Format — Pick your preferred data format. Supported formats include Excel (XLS/XLSX) for business users and SQL script for developers and DBAs who need portable, re-executable data files.
- Configure Options — Depending on the direction (export or import), you can set options such as including schema definitions, filtering rows, or handling conflicts during import (insert, update, or replace).
- Execute — Run the operation and monitor progress in real time, with a detailed log of rows processed, errors encountered, and completion status.
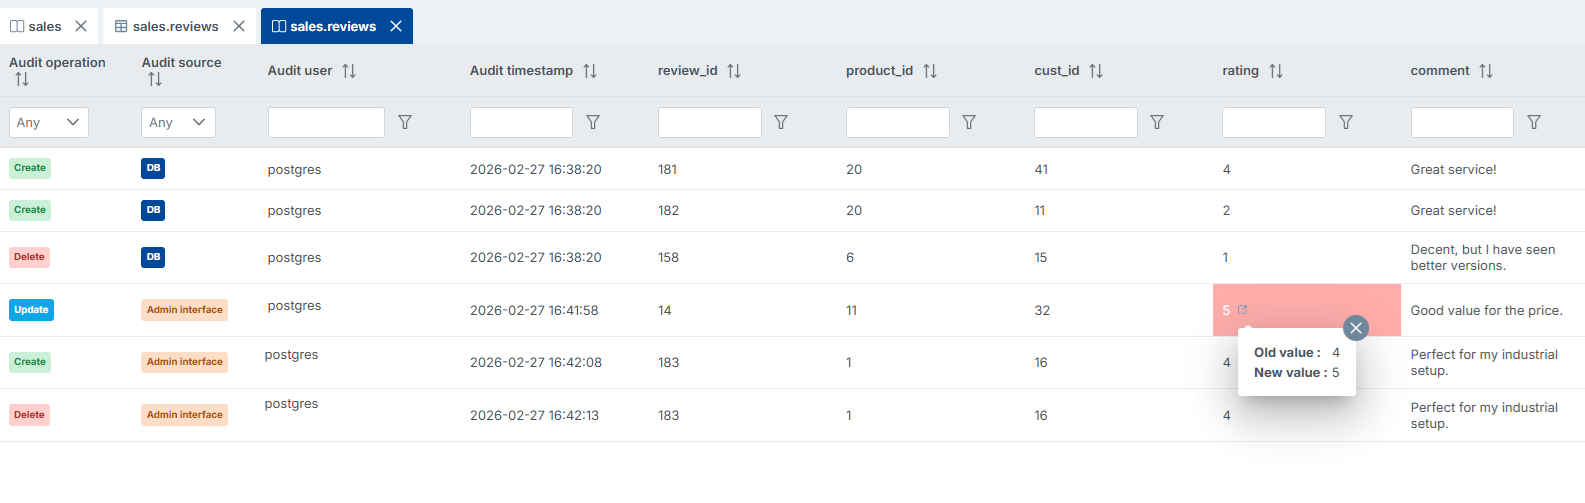
3.3 Audit Data
When the Data Audit option is activated for your database (configured in the General > Audit section), the Audit Data view provides a centralized, searchable log of every data-level transaction — including INSERT, UPDATE, and DELETE operations — with full contextual details.
For each recorded transaction you can see:
- Operation Type — Whether the change was an insert, update, or delete.
- Table & Column Affected — Exactly which table and which columns were modified.
- User & Timestamp — Who performed the change and when, enabling accountability and forensic analysis.
- Old & New Values — When Detailed Audit is enabled, the system captures the previous value and the new value for every changed column, giving you a complete before-and-after snapshot of every modification.
The Detailed Audit mode is especially valuable for regulatory compliance (e.g., GDPR, SOX, HIPAA) where you need to demonstrate exactly what data was changed, by whom, and when — down to the individual field level.
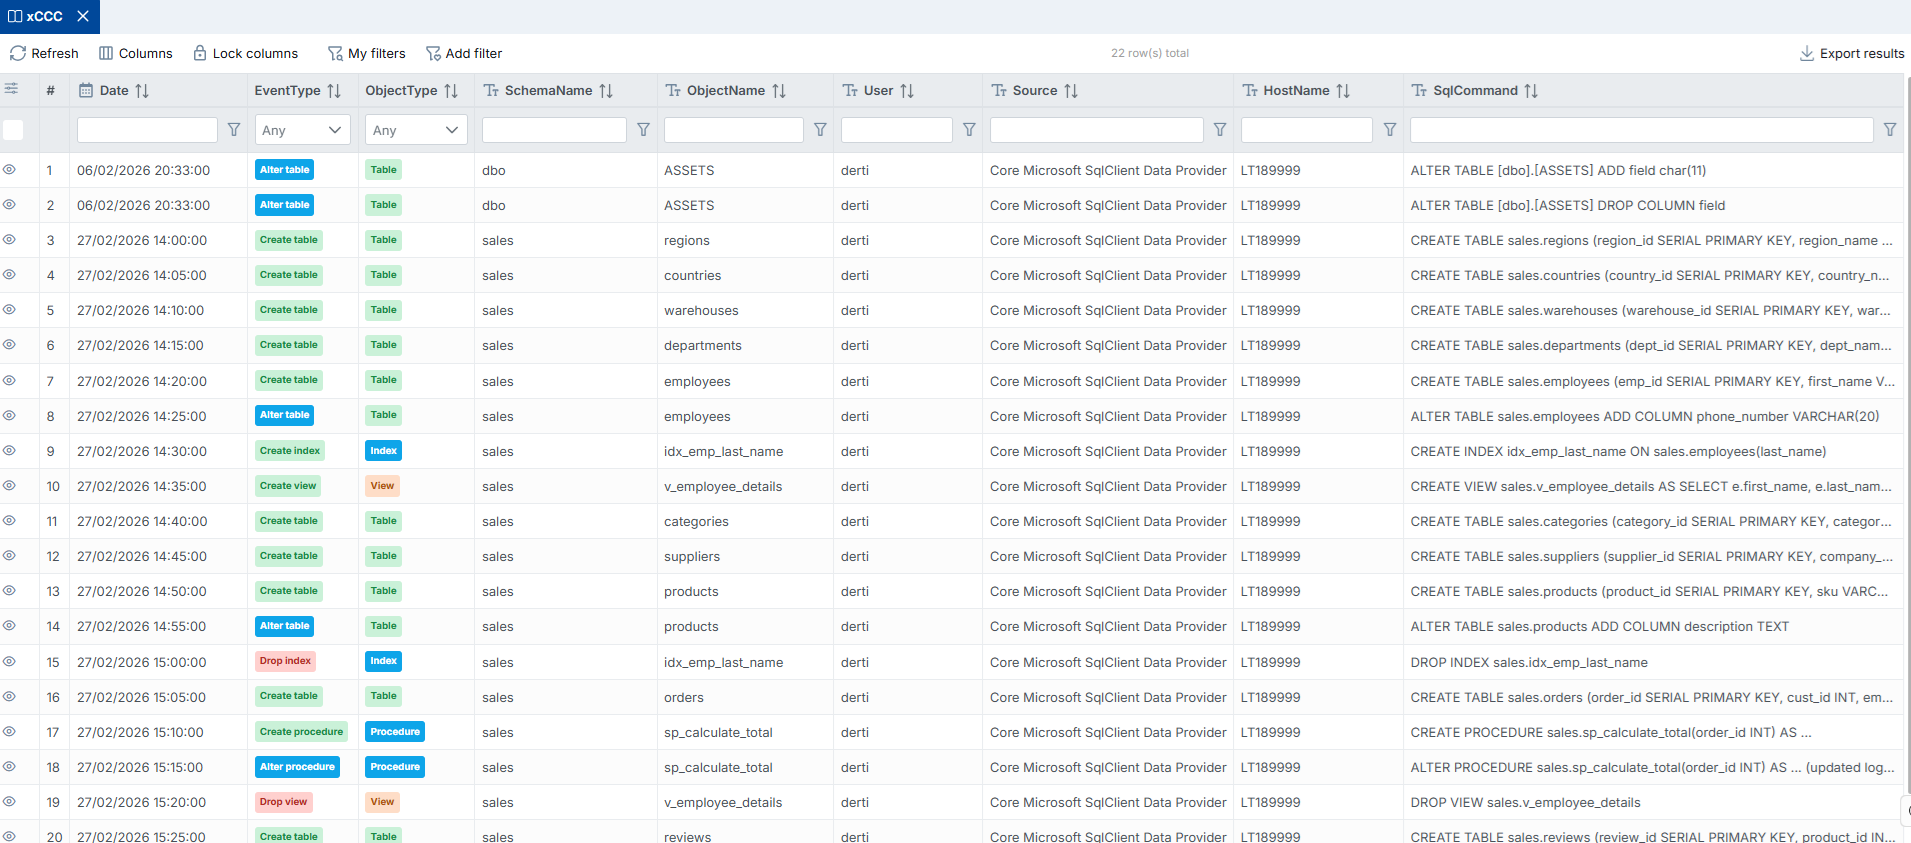
3.4 Audit DDL
The Audit DDL feature tracks all Data Definition Language operations executed against your database — such as CREATE TABLE, ALTER COLUMN, DROP INDEX, and other schema-modifying statements. This gives administrators a complete history of structural changes, which is critical for troubleshooting schema drift, validating deployment scripts, and maintaining compliance records.
When enabled, the DDL audit log records:
- DDL Event Type — The specific operation (CREATE, ALTER, DROP, RENAME, etc.).
- Object Name & Type — The table, view, index, stored procedure, or other object affected by the change.
- Executed Statement — The full DDL command that was run, providing an exact record of what changed.
- User & Timestamp — The identity of the user who executed the statement and the precise date and time of execution.
This audit trail is essential for teams that manage schema changes through CI/CD pipelines, as it allows you to verify that deployment scripts executed as expected and to quickly identify unauthorized or accidental schema modifications.
4. Table Dashboard
The Table Dashboard is a feature-rich workspace dedicated to an individual table or view. When you select any table from the database object tree, this dashboard opens with a comprehensive set of tabs and tools tailored to that specific object — covering everything from data browsing and editing, to charting, schema inspection, and relationship mapping.
The Table Dashboard is designed to be intuitive and self-explanatory. Each tab focuses on a specific aspect of the table, and the interface adapts contextually — for example, views show read-only data panels while base tables expose full CRUD (Create, Read, Update, Delete) capabilities. Below we cover the most important tabs available for each table.
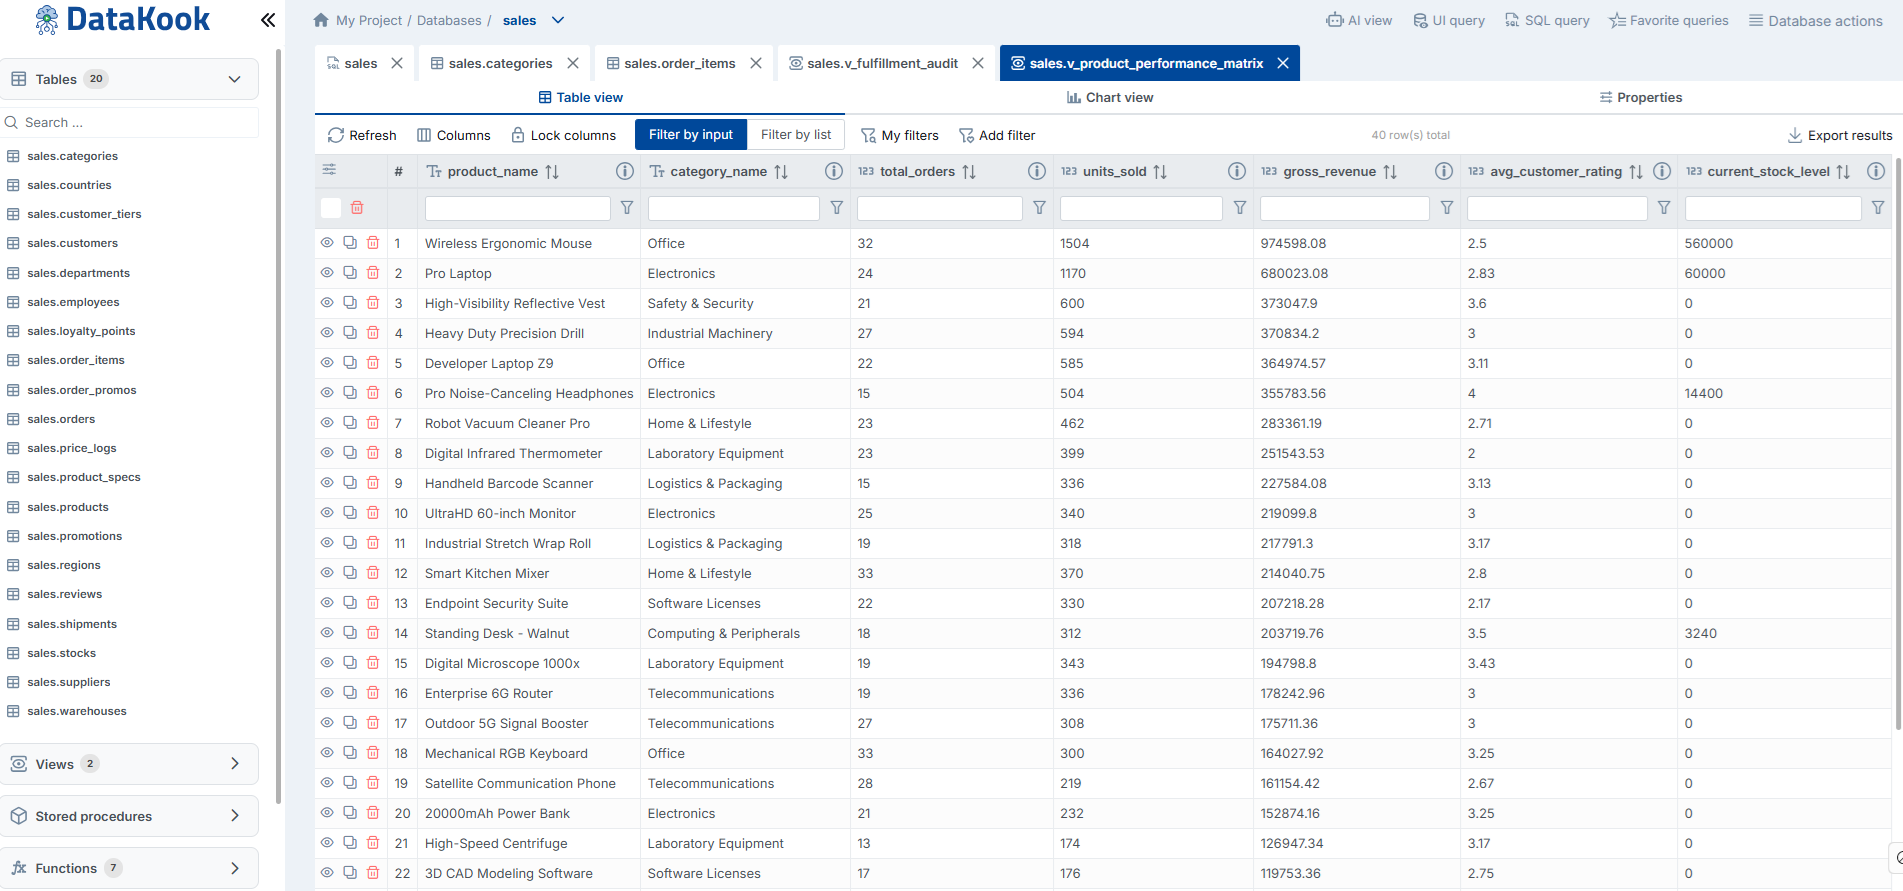
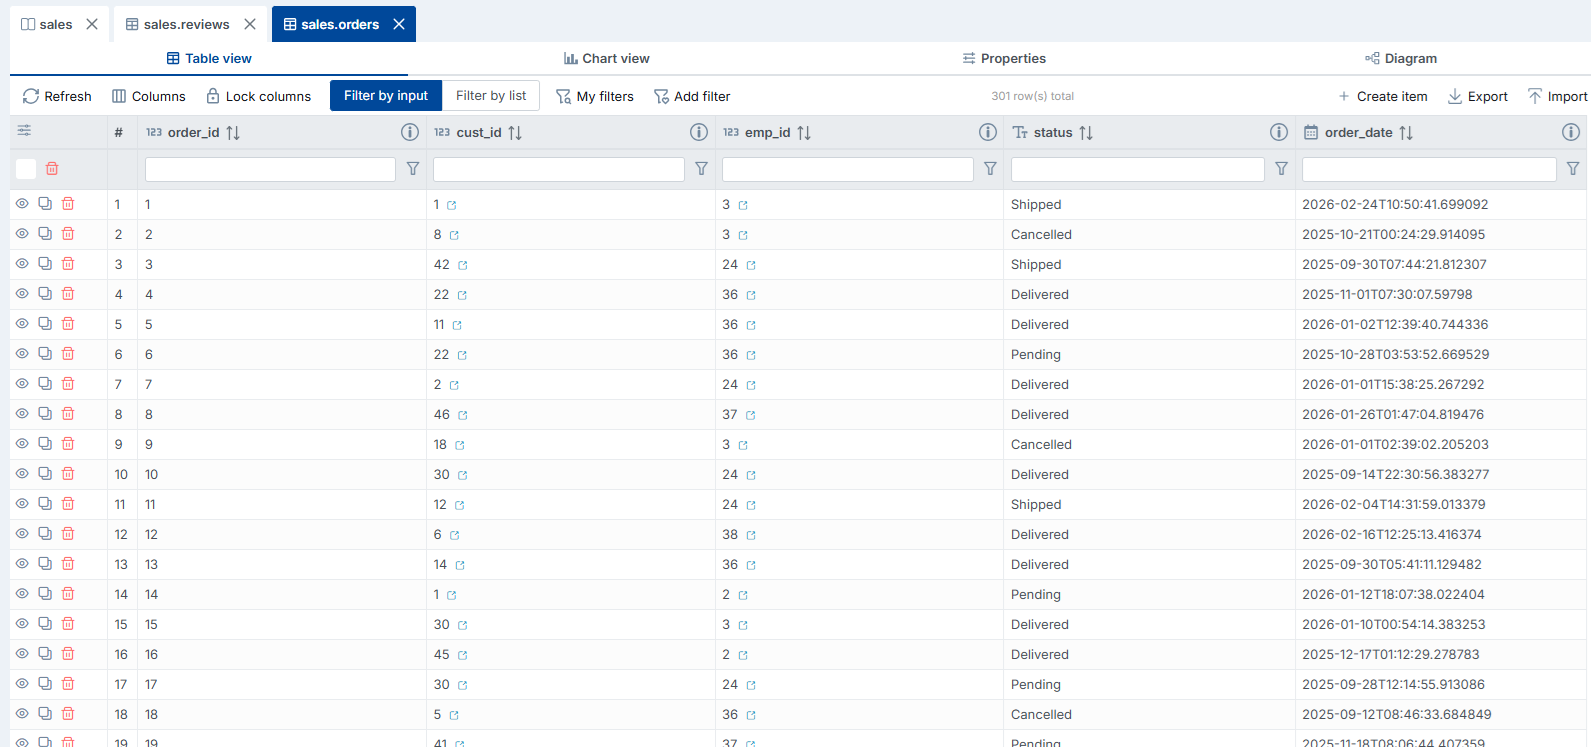
4.1 Table View
The Table View tab is the data-centric heart of the Table Dashboard. It presents the table's contents in a rich, interactive grid that goes far beyond a simple data dump. This is where you browse, search, filter, sort, edit, and manage the data stored in your table.
Key capabilities of the Table View include:
- Inline Data Editing — Click on any cell to edit its value directly in the grid. Changes are saved immediately, with validation applied based on column constraints (data type, nullable, max length, etc.).
- Add & Delete Rows — Insert new records directly from the grid interface or select and delete existing rows with confirmation prompts to prevent accidental data loss.
- Advanced Filtering — Apply multi-column filters with a variety of operators (equals, contains, greater than, between, is null, etc.) to narrow down large datasets to exactly the rows you need. Filters can be combined with AND/OR logic for complex criteria.
- Column Sorting & Reordering — Click any column header to sort ascending or descending; drag columns to rearrange the display order to suit your workflow.
- Pagination & Infinite Scroll — Large tables are loaded progressively, ensuring fast initial render times even for tables with millions of rows.
- Advanced Export — Export the current view (including active filters and sort order) to CSV, Excel, or JSON formats for offline analysis or sharing with stakeholders.
- Advanced Import — Bulk-import data from spreadsheets or CSV files directly into the table, with matched-column mapping and conflict resolution options.
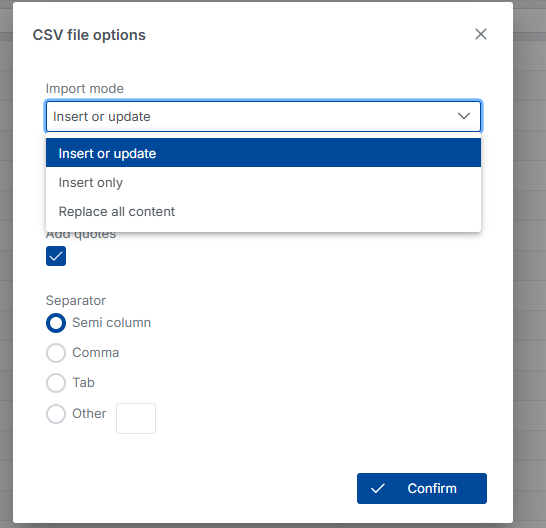
4.1.1 Import Data
The Import Data feature provides a flexible, wizard-driven process for loading external data into any table. Whether you are seeding a new environment, synchronizing data from an external source, or performing a bulk update, the import wizard handles the complexity behind a simple interface.
You can choose from three import strategies:
- Insert or Update — DataKook automatically determines whether each incoming row already exists in the target table. New rows are inserted; existing rows are updated with the incoming values. This is the most common mode for ongoing synchronization.
- Insert Only — Only new rows are added. If a row already exists (based on the matching key), it is skipped. This is ideal for appending fresh data without modifying existing records.
- Replace All Content — The entire table is emptied and repopulated with the imported data. Use this mode with caution — it is designed for scenarios where the imported file represents the complete, authoritative dataset.
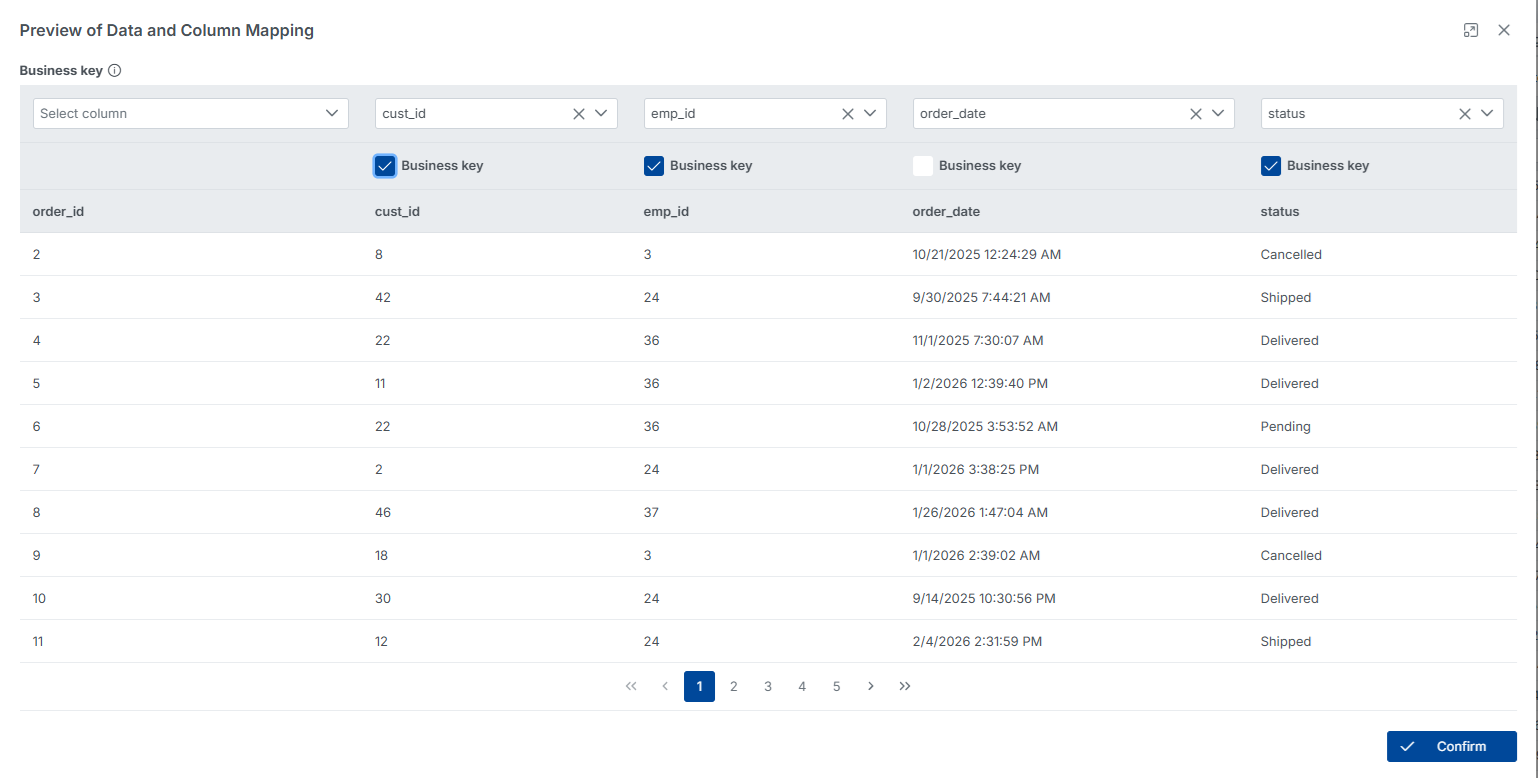
For the Insert or Update strategy, DataKook uses the table's primary key column (typically the Id column) as the default business key for matching incoming rows against existing records. However, you can override this by selecting one or more alternative Business Key columns for matching — for example, using an email or external_id column when the primary key is an auto-generated integer that does not appear in your source file.
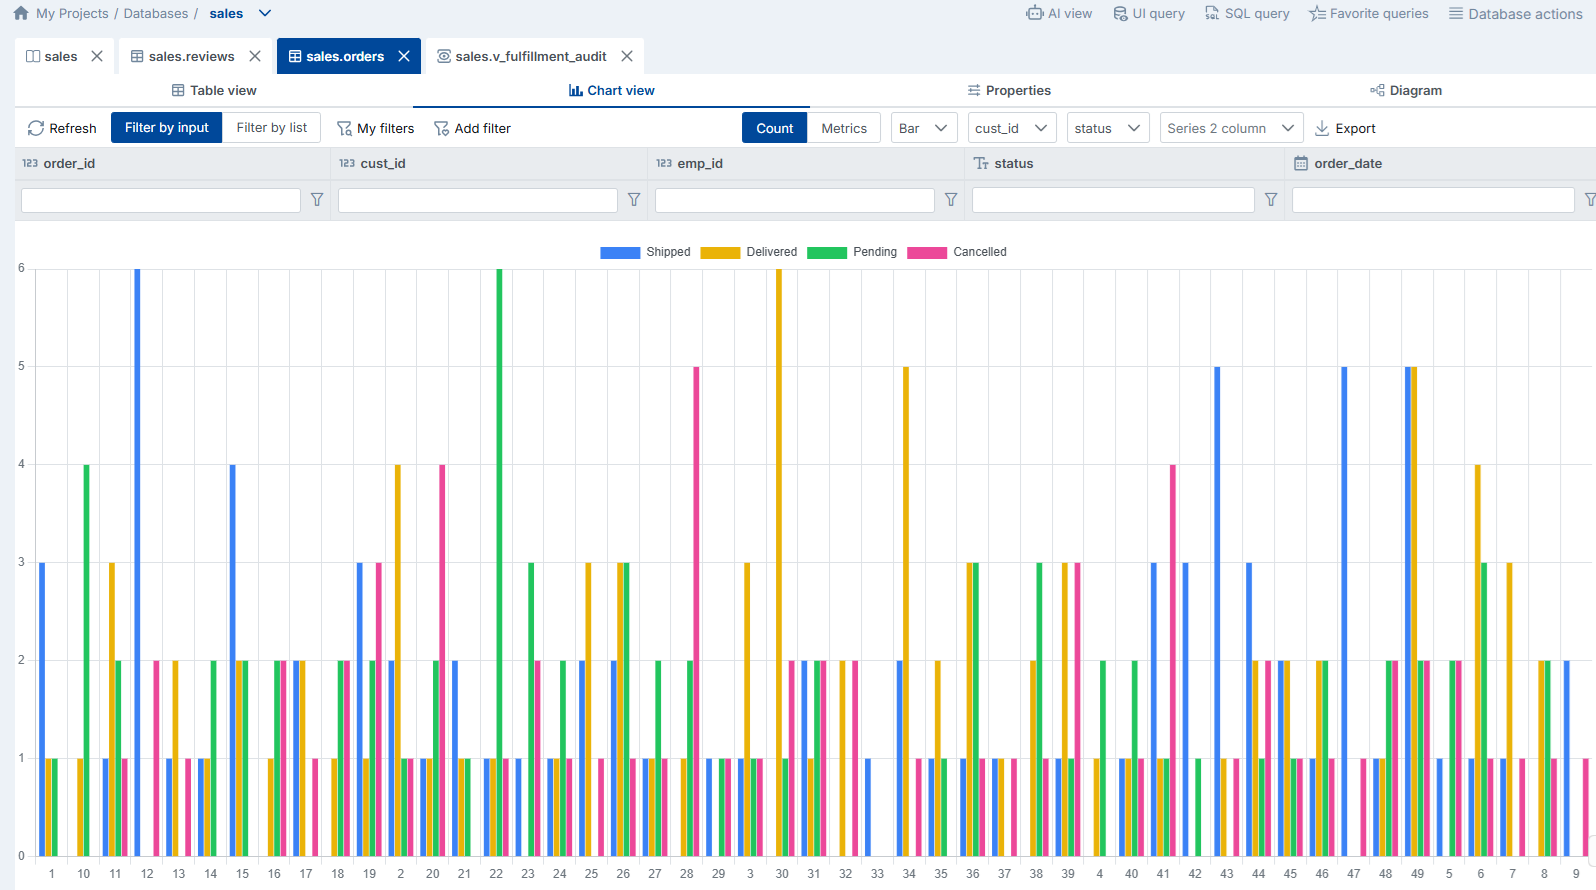
4.2 Chart View
The Chart View tab lets you create instant, interactive visualizations from any table or view — without exporting data to a separate BI tool. This is perfect for quick exploratory analysis, team presentations, and verifying data distribution patterns.
Creating a chart is as simple as selecting the columns you want to plot and choosing a chart type. DataKook handles the aggregation, grouping, and rendering automatically.
Available chart types include:
- Bar Chart — Compare values across categories (e.g., revenue by region, orders by status).
- Line Chart — Track trends over time (e.g., daily active users, monthly sales).
- Pie / Doughnut Chart — Show proportional distribution of a single metric across categories.
All chart types support the advanced filtering system. Apply filters to narrow the dataset before charting, so you can compare time periods, segments, or any other slice of your data without altering the underlying table.
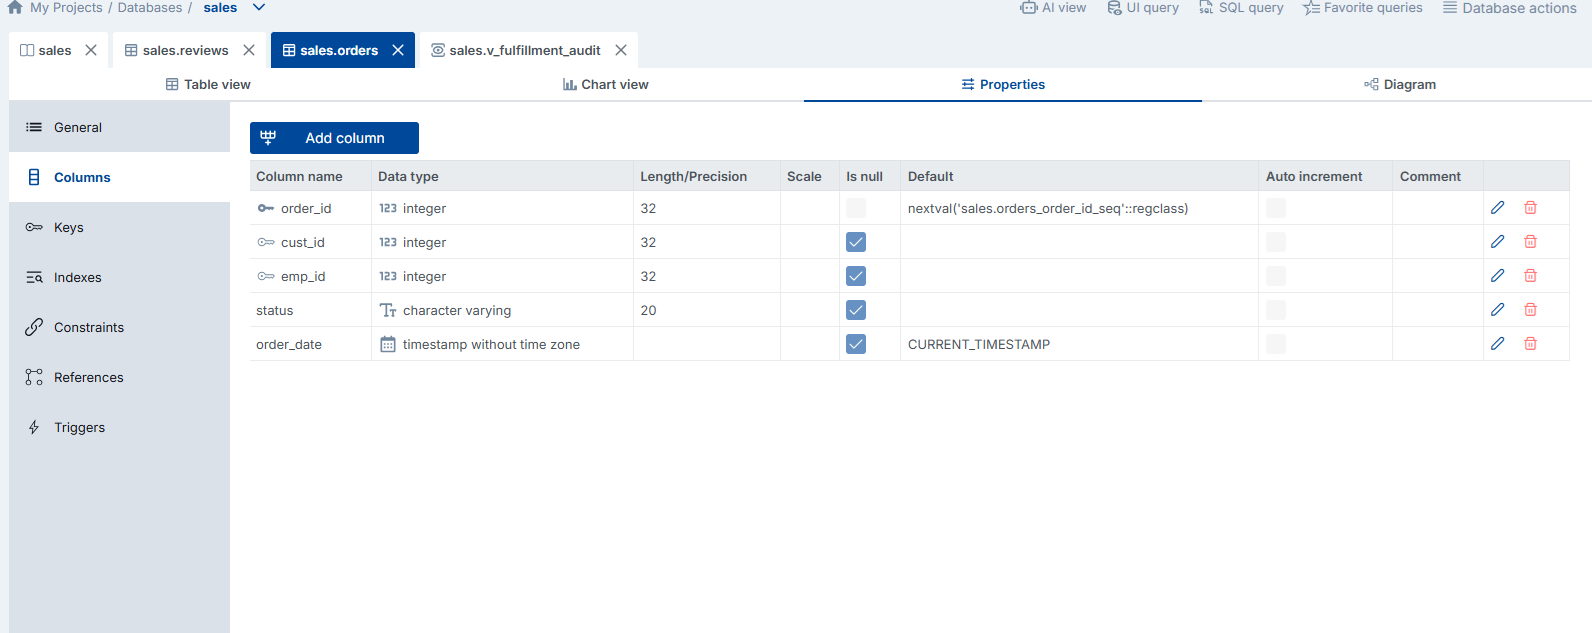
4.3 Properties
The Properties tab displays the complete structural metadata for the selected table. This is your go-to reference for understanding the exact schema definition, and for making structural modifications when needed — all without leaving the DataKook interface.
The Properties tab is organized into the following sub-panels:
- Columns — A detailed list of every column in the table, showing the column name, data type, nullability, default value, and any computed-column expressions. You can add new columns, modify existing column properties, or drop columns directly from this panel.
- Keys — Displays all primary keys and foreign keys defined on the table. Foreign-key entries show the referenced table and column, making it easy to trace relationships. You can create new keys or remove existing ones.
- Indexes — Lists all indexes (clustered, non-clustered, unique, filtered) with their included columns and index options. Proper indexing is critical for query performance, and this panel gives you a clear overview of the current index strategy.
- Constraints — Shows check constraints, unique constraints, and default constraints applied to the table. Constraints enforce data integrity rules at the database level, and this panel lets you review and manage them in one place.
- References — A reverse-lookup view that lists all other tables that reference the current table through foreign keys. This is invaluable for understanding the impact of schema changes — before altering or dropping a column, you can see exactly which dependent tables would be affected.
- Triggers — Lists any triggers defined on the table (AFTER INSERT, AFTER UPDATE, AFTER DELETE, INSTEAD OF, etc.), along with their definitions. Triggers are powerful but can be difficult to track — this panel keeps them visible and manageable.
4.4 Diagram
The Diagram tab generates a focused DDL entity-relationship diagram centered on the selected table and all of its directly linked tables. Unlike the full database diagram (which can be overwhelming for large schemas), this table-level diagram shows only the immediate neighborhood — the selected table and every table connected to it through foreign-key relationships.
This scoped view is ideal for understanding how a specific table fits into the broader data model. It clearly displays column names, data types, primary keys, foreign keys, and the direction and cardinality of each relationship. You can use it to quickly verify that your joins are correct, to document a specific subsystem of your database, or to onboard a new team member on a particular area of the schema.
The diagram updates automatically when the schema changes — if you add a new foreign key or link a new table, the diagram reflects the change immediately without requiring a manual refresh.